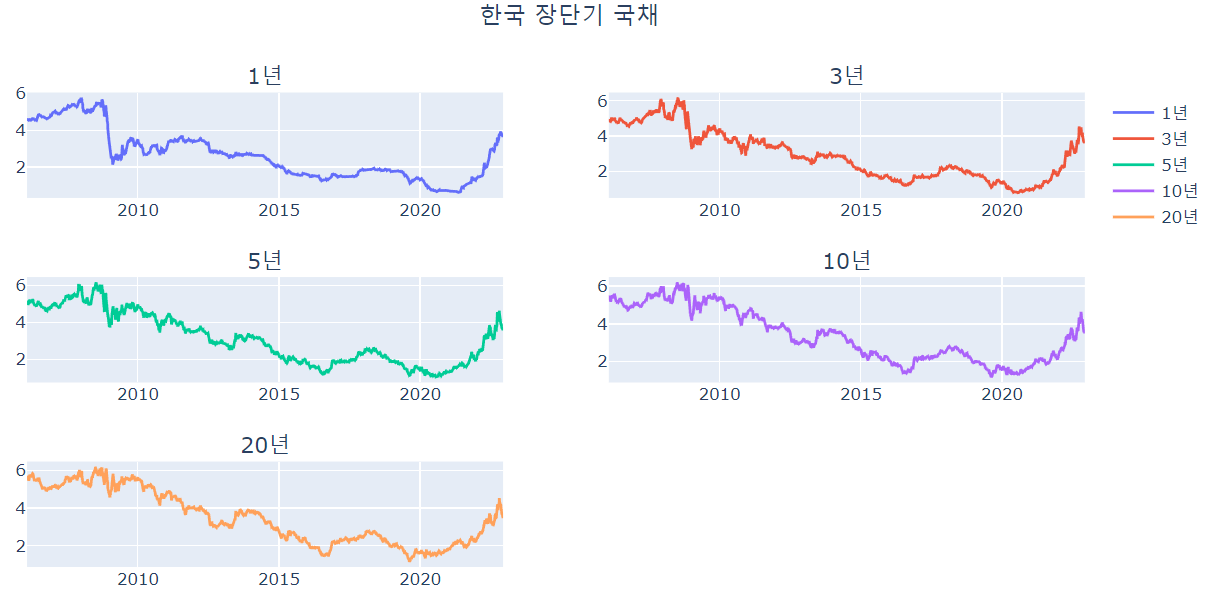
한국은행 API를 이용해서 우리나라 국채의 장단기 국채의 데이터를 수집해서 그래프로 확인하고,
2022년 수익률 곡선을 그려보겠습니다.
확인을 위해서는 한국은행 API에 가입이 되어 있어야 합니다.
1. 한국은행 API 가입
2. 장단기 수익률 데이터 수집 및 확인(1년, 3년, 5년, 10년, 20년)
3. 수익률 곡선 그리기(2022년)
1. 한국은행 API 가입
[한국은행 API] 인증키 신청 및 100대 통계 지표 수집
한국은행 API에 가입하고 서비스 항목 중 100대 통계지표에 대해 데이터 수집하고 그래프로 확인해보겠습니다. 1. 인증키 신청 2. 인증키 확인 3. 100대 통계 지표 수집 1. 인증키 신청 사이트 접속
yenpa.tistory.com
2. 장단기 수익률 데이터 수집 및 확인(1년, 3년, 5년, 10년, 20년)
한국은행 API의 통계조회 조건 설정의 서비스에서 통계항목코드1을 '817Y002'로
지정하면 금리에 대한 정보를 불러올 수 있습니다.
아래는 금리에 대한 정보(817Y002)를 20221201~20221217 기간에서 일별로 조회한 코드입니다.
import requests

url = 'https://ecos.bok.or.kr/api/StatisticSearch/' + apikey \
        + '/json/kr/1/100/817Y002/D/20221201/20221217'
response = requests.get(url)
result = response.json()
list_total_count=(int)(result['StatisticSearch']['list_total_count'])
list_count=(int)(list_total_count/100) + 1


rows=[]
for i in range(0,list_count):
    start = str(i * 100 + 1)
    end = str((i + 1) * 100)

    url = 'https://ecos.bok.or.kr/api/StatisticSearch/' + apikey + '/json/kr/' \
            + start + '/' + end + '/817Y002/D/20221201/20221217'
    response = requests.get(url)
    result = response.json()
    rows = rows + result['StatisticSearch']['row']

df=pd.DataFrame(rows)
df
호출 URL이고 한 번에 최대 100개까지의 데이터만 불러올 수 있습니다.
100개가 넘을 경우에는 100개씩 나누어서 데이터를 수집해야 되는데,
result['StatisticSearch']['list_total_count'] 에서 확인이 가능합니다.
url = 'https://ecos.bok.or.kr/api/StatisticSearch/' + apikey \
        + '/json/kr/1/100/817Y002/D/20221201/20221217'
response = requests.get(url)
result = response.json()
list_total_count=(int)(result['StatisticSearch']['list_total_count'])
list_count=(int)(list_total_count/100) + 1
start는 1, 101, 201... 이 되고, end는 100, 200, 300...으로 지정이 되어
for문당 100개씩의 데이터 수집이 가능하게 됩니다.
rows=[]
for i in range(0,list_count):
    start = str(i * 100 + 1)
    end = str((i + 1) * 100)

    url = 'https://ecos.bok.or.kr/api/StatisticSearch/' + apikey + '/json/kr/' \
            + start + '/' + end + '/817Y002/D/20221201/20221217'
    response = requests.get(url)
    result = response.json()
    rows = rows + result['StatisticSearch']['row']
100개씩 rows라는 list에 저장 후 마지막에 Dataframe으로 변환했습니다.
df=pd.DataFrame(rows)
ITEM_NAME1의 정보를 확인해보면 국고채 이외에도 다른 금리에 대한 정보가 포함되어 있습니다.
df3Y.groupby('ITEM_CODE1')[['ITEM_CODE1','ITEM_NAME1']].first()국채 금리를 사용하기 때문에 중간에 국고채(1년) ~ 국고채(20년)까지의 ITEM_CODE1을 기록해두시면 됩니다.

010190000 국고채(1년)
010200000 국고채(3년)
010200001 국고채(5년)
010210000 국고채(10년)
010220000 국고채(20년)
국채 기간별 API 호출 코드는 ITEM_CODE1 만 다르고 다른 부분은 동일합니다.
아래와 같이 함수를 만들고, 각각 호출해보겠습니다.
위의 코드에서 달라진 점은 ITEM_CODE_1만 변수로 수정했고,
기간을 20060201 ~20221210까지로 설정했습니다.(20년 데이터가 2006년부터 있음)
2년, 30년 데이터는 데이터의 기간이 짧아 제외했습니다.
import requests

def getdata(ITEM_CODE1):

    url = 'https://ecos.bok.or.kr/api/StatisticSearch/' + apikey \
            + '/json/kr/1/100/817Y002/D/20060201/20221210/' + ITEM_CODE1
    response = requests.get(url)
    result = response.json()

    list_total_count=(int)(result['StatisticSearch']['list_total_count'])
    list_count=(int)(list_total_count/100) + 1


    rows=[]
    for i in range(0,list_count):
        start = str(i * 100 + 1)
        end = str((i + 1) * 100)

        url = 'https://ecos.bok.or.kr/api/StatisticSearch/' + apikey + '/json/kr/' \
                + start + '/' + end + '/817Y002/D/20060201/20221210/' + ITEM_CODE1
        response = requests.get(url)
        result = response.json()
        rows = rows + result['StatisticSearch']['row']

    df=pd.DataFrame(rows)

    df['date']=pd.to_datetime(df['TIME'].str[:4] + '-' + \
            df['TIME'].str[4:6] + '-' + df['TIME'].str[6:8] )
    df = df[['date','DATA_VALUE']].set_index('date')
    df=df.astype('float')

    return df
날짜가 20060101의 형태로 되어있어, datetime의 column으로 생성했습니다.
이후 date와 DATA_VALUE만 가져와서 date를 index로 설정하고 DATA_VALUE를 float형태로 변환했습니다.
df['date']=pd.to_datetime(df['TIME'].str[:4] + '-' + \
        df['TIME'].str[4:6] + '-' + df['TIME'].str[6:8] )
df = df[['date','DATA_VALUE']].set_index('date')
df=df.astype('float')
각 기간별 국채 금리를 호출하겠습니다.
df1Y = getdata('010190000')
df3Y = getdata('010200000')
df5Y = getdata('010200001')
df10Y = getdata('010210000')
df20Y = getdata('010220000')
df1Y
국채 1년 데이터 수집이 되었습니다.

그래프로 확인해 볼까요
import plotly.express as px
from plotly.subplots import make_subplots
import plotly.graph_objects as go

fig = make_subplots(rows=3, cols=2,
       subplot_titles=("1년", "3년", "5년", "10년","20년"))


fig.add_trace(
    go.Scatter(x=df1Y.index, y=df1Y['DATA_VALUE'], name="1년"),
    row=1,col=1,
)
fig.add_trace(
    go.Scatter(x=df3Y.index, y=df3Y['DATA_VALUE'], name="3년"),
    row=1,col=2,
)
fig.add_trace(
    go.Scatter(x=df5Y.index, y=df5Y['DATA_VALUE'], name="5년"),
    row=2,col=1,
)
fig.add_trace(
    go.Scatter(x=df10Y.index, y=df10Y['DATA_VALUE'], name="10년"),
    row=2,col=2,
)
fig.add_trace(
    go.Scatter(x=df20Y.index, y=df20Y['DATA_VALUE'], name="20년"),
    row=3,col=1,
)


fig.update_layout(title_text='한국 장단기 국채', title_x=0.5)

fig.show()
하나의 그래프로 합쳐보겠습니다.
fig = go.Figure()


fig.add_trace(
    go.Scatter(x=df1Y.index, y=df1Y['DATA_VALUE'], name="1년"),
)
fig.add_trace(
    go.Scatter(x=df3Y.index, y=df3Y['DATA_VALUE'], name="3년"),
)
fig.add_trace(
    go.Scatter(x=df5Y.index, y=df5Y['DATA_VALUE'], name="5년"),
)
fig.add_trace(
    go.Scatter(x=df10Y.index, y=df10Y['DATA_VALUE'], name="10년"),
)
fig.add_trace(
    go.Scatter(x=df20Y.index, y=df20Y['DATA_VALUE'], name="20년"),
)


fig.update_layout(title_text='한국 장단기 국채', title_x=0.5)

fig.show()
장단기 금리차의 간격이 좁은 구간과 넓은 구간들이 있는 것이 확인이 됩니다.

3. 수익률 곡선 그리기(2022년)
2022년 전체 데이터 수집 후 일부 데이터로 축소해서 확인하겠습니다.
df에서 22년 1일, 3일의 데이터만 뽑아서 df1에 저장했습니다.
import pandas as pd

df=pd.concat([df1Y,df3Y,df5Y,df10Y,df20Y],axis=1)
df.columns=['1년','3년','5년','10년','20년']
df1=df.loc[df.index.strftime('%y%d').isin(['2201','2203'])]
df1
df1을 transpose 해서 수익률 그래프를 그리기 좋은 형태로 변형시킵니다.
df2=df1.transpose()
df2
그래프로 확인하겠습니다.
fig=px.line(data_frame=df2,x=df2.index, y=list(df2.columns.strftime("%Y-%m-%d")),
           facet_col='variable',facet_col_wrap=4)
fig.update_layout(title_text='2022년 국채 장단기금리 수익률곡선',title_x=0.5)
fig.show()
1~3월은 우상향 그래프를 유지했었는데, 8월 이후로 가면 장단기의 수익률의 차이가
줄어들고 12월에는 거의 비슷한 것을 확인할 수 있습니다.

관심 있으신 분은 미국 국채와 비교해보셔도 좋을 것 같습니다.
https://yenpa.tistory.com/69
[Fred API] 미국 장단기 국채 수익률 곡선 그래프(2년, 3년, 5년, 10년, 20년, 30년)
Fred API를 이용해서 미국 국채의 장단기 국채의 데이터를 수집해서 그래프로 확인하고, 2022년 수익률 곡선을 그려보겠습니다. Fredpy로 데이터를 수집하는데 Fred API Key가 필요합니다. 1. Fred 가입 후
yenpa.tistory.com
이상으로 우리나라 국채의 장단기 국채의 데이터를 수집해서 그래프로 확인하고,
2022년 수익률 곡선을 그려봤습니다.
'API' 카테고리의 다른 글
| [한국은행 API] 주요 국가의 생산자 물가 비교 (4) | 2022.12.23 |
|---|---|
| [한국은행 API] 주요 국가의 소비자 물가 비교 (5) | 2022.12.22 |
| [fred 한국은행 API] 한국과 미국의 M1(협의통화), M2(광의통화) 비교 (4) | 2022.12.15 |
| [한국은행 API] 주요 국가의 중앙은행 정책금리 비교 (4) | 2022.12.13 |
| [fred yahoo API] 소비자심리지수와 S&P500, 달러인덱스, 금 데이터 비교하기 (4) | 2022.12.12 |


